How to find individual Amazon S3 bucket cost?
Amazon Simple Storage Service (Amazon S3) is an object storage service that offers industry-leading scalability, data availability, security, and performance. Amazon S3 offers a range of storage classes designed for different use cases allowing customers to take control of costs and continuously optimize spend, while building modern, scalable applications.
One common question that we get from customers is how to gain insights into individual Amazon S3 bucket cost. AWS Cost Explorer has an easy-to-use interface that lets you visualize, understand, and manage your S3 storage cost and usage over time. However, it does not list individual S3 bucket cost in an AWS account. In this blog, we use Cost and Usage Report (CUR) and create visualization dashboards in Amazon QuickSight that would help the customers gain insights into individual cost of all S3 buckets in an AWS Account, without performance impact or operational overhead.
This Amazon S3 cost and usage visuals will allow you to gain insights into cost of individual S3 buckets across different AWS Accounts and all S3 operations.
To name a few….
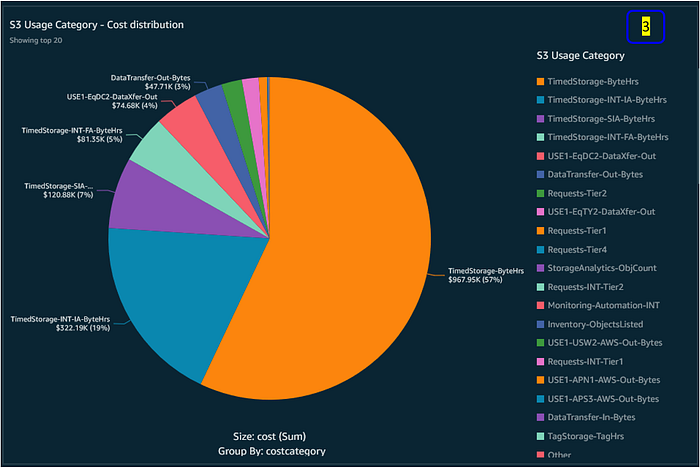
- You can find the cost of objects stored in individual storage classes within the same bucket. Refer usage types ‘TimedStorage-ByteHrs, TimedStorage-INT-FA-ByteHrs, TimedStorage-INT-AIA-ByteHrs, TimedStorage-INT-AA-ByteHrs, TimedStorage-INT-DAA-ByteHrs’ etc.
- If you are using S3 Intelligent-Tiering, you can find out the cost of object monitoring and automation charge per bucket! Refer usage type `Monitoring-Automation-INT`.
- You can find DataTransfer-In and Out cost per bucket. Refer usage type `DataTransfer-Out-Bytes and DataTransfer-In-Bytes`
- You can find S3 ‘lifecycle operations’ cost per bucket. Refer usage type`Requests-Tier3'
- You can find S3 Batch operations cost per bucket. Refer usage type`BatchOperations-Jobs`
Solution Overview

Prerequisites
For this walk-through, you need the following:
- AWS Account
- AWS CloudFormation
- Amazon Athena
- Amazon QuickSight Enterprise edition
- AWS Identity and Access Management (IAM) user/role with necessary privileges.
Solution walk-through
At a high level, the steps can be summarized as follows:
- Create a CUR report
include — resource IDs
data refresh — automatically
data granularity — hourly
data integration — Amazon Athena - Setup Amazon S3 bucket to receive and store the reports.
- Setup Amazon Athena to query the reports.
- Create QuickSight dashboard using Amazon Athena as the data source.
Implementation
Enabling CUR Data for Amazon Athena Integration
Cost and Usage Report (CUR) data contains granular details on your AWS resource usage. It contains cost breakdown of your resources based on the hour, day, or month, and by AWS service or by user-defined cost allocation tags. CUR data is configured to deliver the granular data point per resource to the Amazon S3 bucket following the instructions here. During the initial configuration, it can take up to 24 hours for AWS to start delivering reports to your Amazon S3 bucket. After delivery starts, AWS Cost and Usage reports are delivered once a day in a parquet format which enables integration with Amazon Athena.
Creating a CUR and Amazon Athena integration pipeline
To streamline and automate integration of your Cost and Usage Reports with Athena, use this AWS CloudFormation template which creates resources along with the reports that you set up for Athena integration. This pipeline delivers up-to-date CUR data to Athena.
Creating Amazon Athena View for Amazon QuickSight Integration
To visualize and analyze the S3 bucket cost and usage data, you need to create a custom Athena view. An Amazon Athena view is a logical table and it creates a subset of columns from the original CUR table to simplify the querying of data.
Now, Create a new Amazon Athena view by using the following query. This query fetches cost and usage of Amazon S3 across all the AWS Accounts in your Organization.
CREATE OR REPLACE VIEW s3_bucket_cost AS
SELECT
  line_item_usage_type,
  line_item_resource_id distribution,
  month,
  year,
  ("sum"(line_item_usage_amount) / 1024) "Usage (TB's)" ,
  "sum"(line_item_unblended_cost) cost
FROM
  database.tablename #replace database.tablename with your database and table name
WHERE (product_product_name = 'Amazon Simple Storage Service')
GROUP BY line_item_usage_type, line_item_resource_id, month, year
ORDER BY "sum"(line_item_unblended_cost) DESC
Create Amazon QuickSight dashboard
Now, let’s create a QuickSight dashboard to visualize the storage cost of S3 buckets.
1. On AWS Management Console, navigate to QuickSight service and then select your AWS Region from top right corner. Note that QuickSight Dataset should be in the same AWS Region as that of Amazon Athena table.
2. Make sure that QuickSight can access S3 and Athena.
3. Create QuickSight Dataset by selecting the data-source as the Amazon Athena view that you created before. Use this procedure to schedule refreshing the Dataset on a daily basis.
4. Create QuickSight Analysis.
5. Create QuickSight Visuals to meet your needs.
6. Format the Visual to meet your needs.
7. Now, you can publish your dashboard from the Analysis.
8. You can send the dashboard in report form to individuals or groups, either once or on a schedule.
The following is a sample QuickSight dashboard.
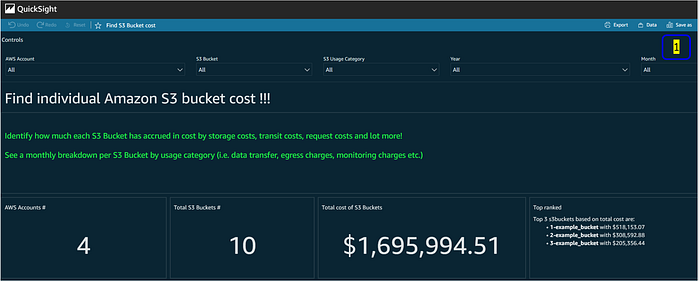

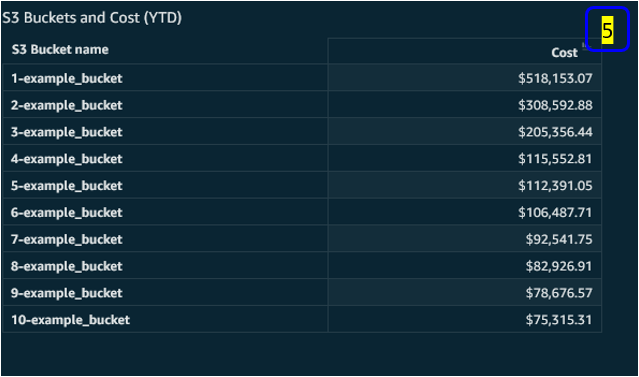
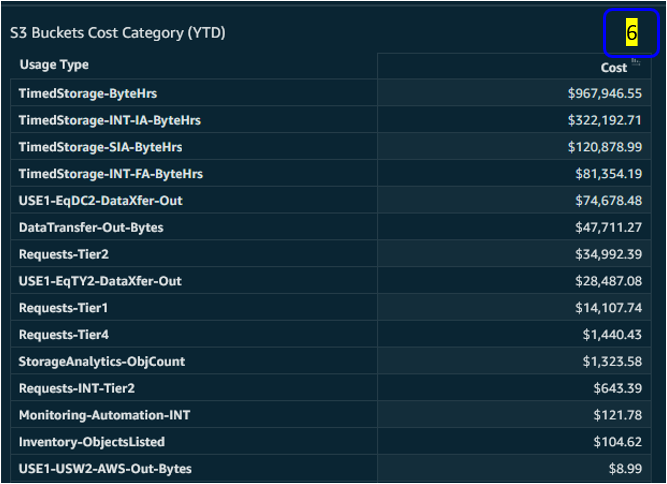
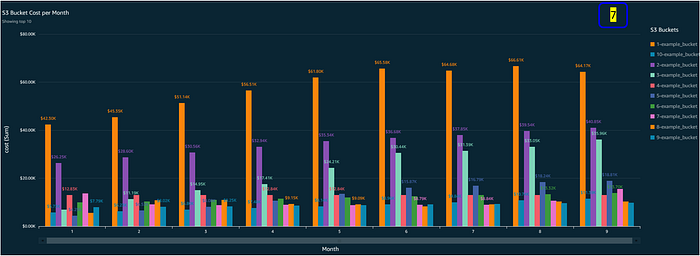
· Widget ‘1’ is the title of the dashboard, with filter controls and visual type Key Performance Indicator (KPI)
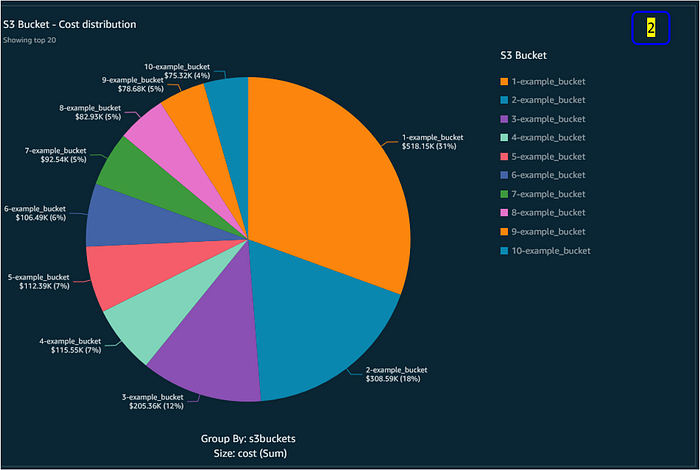
· Widgets ‘2’, ‘3’, and ‘4’ uses the visual type Pie chart
· Widgets ‘5’ and ‘6’, uses the visual type Pivot table
· Widget ‘7’, use the visual type Vertical Bar chart
With the preceding dashboard, you are now able to identify the storage cost of hundreds of S3 buckets in the AWS account. You can use other QuickSight visual types to build different dashboards to suit your requirements.
Exporting Amazon QuickSight dashboard
The QuickSight dashboard that you created is a reusable resource that you can export to another AWS Organization/Account. For further reading, check out our AWS Savings plan blog and refer the section ‘Export Amazon QuickSight dashboard from an Organization/Account to another Organization/Account’.
Cleaning up
To avoid ongoing charges in your AWS account, you should delete the AWS resources listed in the prerequisites section of this post. Furthermore, log in to the AWS Management Console and delete any manually created resources.
Conclusion
The Amazon QuickSight dashboard created in this blog post will help customers gain insights into storage cost of S3 buckets in an AWS account. This Amazon QuickSight dashboard would help the customers gain insights into individual cost of all S3 buckets, without performance impact or operational overhead. Companies of any size can adopt this proactive approach to cloud cost optimization strategy and improve business efficiency through cloud cost analytics and data-driven decisions.
For further reading, please refer AWS Well-Architected Framework, Architecture Best Practices for Cost Optimization, Architecture Best Practices for Storage and AWS Storage Optimization.